Traffic Analysis for Port 2
The statistics were last updated Wednesday, 29 November 2017 at 15:55,
at which time the device had been up for 200 days, 3:29:40.
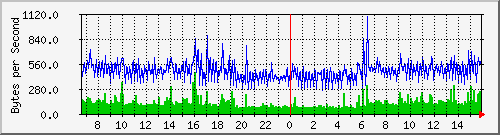
`Daily' Graph (5 Minute Average\)
|
Max |
Average |
Current |
| In |
470.0 B/s (0.0%) |
118.0 B/s (0.0%) |
154.0 B/s (0.0%) |
| Out |
1086.0 B/s (0.0%) |
475.0 B/s (0.0%) |
606.0 B/s (0.0%) |
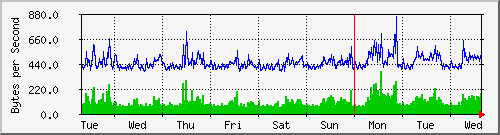
`Weekly' Graph (30 Minute Average\)
|
Max |
Average |
Current |
| In |
377.0 B/s (0.0%) |
102.0 B/s (0.0%) |
178.0 B/s (0.0%) |
| Out |
851.0 B/s (0.0%) |
448.0 B/s (0.0%) |
521.0 B/s (0.0%) |
`Monthly' Graph (2 Hour Average\)

|
Max |
Average |
Current |
| In |
415.0 B/s (0.0%) |
103.0 B/s (0.0%) |
144.0 B/s (0.0%) |
| Out |
12.7 kB/s (0.0%) |
486.0 B/s (0.0%) |
497.0 B/s (0.0%) |
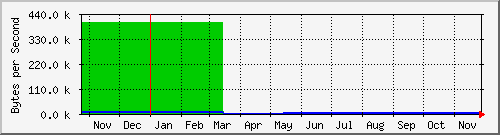
`Yearly' Graph (1 Day Average\)
|
Max |
Average |
Current |
| In |
401.5 kB/s (0.3%) |
166.1 kB/s (0.1%) |
122.0 B/s (0.0%) |
| Out |
7448.0 B/s (0.0%) |
3343.0 B/s (0.0%) |
483.0 B/s (0.0%) |
| GREEN ### |
Incoming Traffic in Bytes per Second |
| BLUE ### |
Outgoing Traffic in Bytes per Second |


